Topic hub — 2026-10-21
Does adding sugar or salt suppress bitterness?
A caveat first: the question here is whether, with the bitter compound unchanged, adding sugar or salt makes people perceive less bitterness (taste suppression); it is not about preparation that removes bitter compounds. When a dish turns out bitter, a little sugar or salt is often suggested. What do studies that added sugar or salt to bitter solutions or foods and had people compare bitterness say? This page lines up the included studies together with their conditions: the bitterants or foods, how much sugar or salt was added, and who rated them on what scale. Comparisons in which removing salt also changed other components, and tests mixing in foods that contain sugar or salt, are marked as such. It then separates what was established within one experiment, what differences between studies might explain, and what this comparison alone cannot separate. It is about how bitterness is perceived, not dietary or health advice.
On this page (10 sections)
- What this page establishes
- What the included studies allow us to say
- Bitterness ratings at a glance
- Conditions and results, study by study
- What was established within an experiment
- Candidate explanations for the differences
- What is not known — what this comparison alone cannot separate
- How studies and rows were counted
- What we looked at
- Read in the encyclopedia
What this page establishes
- That with the bitter compound unchanged, adding salt lowered bitterness in some studies, whose authors attribute this mainly to sodium; but among comparisons adding salt to quinine, one detected no significant suppression in pairwise tests and another reports no test.
- That adding sugar also lowered bitterness: in a study using quinine sulphate the drop was significant in pairwise tests against the solution without sugar, while in another study using quinine hydrochloride the figure values were lower but no test is reported; in the pudding study sweetness rose at the same time and there was no sugar-free control.
- That with sugar and salt added together the reported value was lower than with either alone, but no test of that difference is reported and the effect of each cannot be separated.
- That mixing in foods containing sugar or salt lowered bitterness, but so did unsalted butter and cream, chosen for their fat, so the effect cannot be attributed to sugar or salt alone.
- That bitterants and scales differ between studies, so the size of the drop cannot be compared side by side.
What the included studies allow us to say
- Adding salt, with the bitter compound unchanged, lowered the bitterness people perceived. Adding 5–80 mM NaCl to caffeine, quinine and urea solutions gave lower bitterness at higher concentrations for every bitterant (P<.001), while KCl, CaCl2 and MgCl2 suppressed only weakly; the authors attribute the effect mainly to sodium. In a bitter amino-acid solution, NaCl at 0.25% and 0.5% also lowered bitterness (significant at the 1% level). In 2 other studies that added NaCl to quinine, however, the reported values were lower with NaCl, but one reports no test (about 1.65 to about 0.28, approximate from a figure) and in the other no significant suppression was detected in the pairwise test (on log ratings, approximate from a figure: with NaCl about 0.92, without about 1.20). [rows: Kondoh 2026a Across NaCl 5–80 mM; Okada 1997 NaCl 0.25% and 0.5% vs none; Nakamura 2002 NaCl 300 mM vs none; Green 2010 NaCl 0.32 M vs none]
- Sugar went the same way. In a study using a quinine sulphate solution, adding sucrose gave lower bitterness than without it, significant in the pairwise test (on log ratings, approximate from a figure: with sucrose about 0.82, without about 1.20; p<0.05). In another study using a quinine hydrochloride solution the bitterness score also appeared lower with sucrose, but no test is reported (about 1.65 to about 0.0, approximate from a figure). In chocolate pudding with the same cocoa, more sucrose gave lower bitterness (1138 analysed, p<0.0001), though there was no zero-sucrose control and sweetness rose at the same time. Mixing in foods containing sugar or salt also lowered bitterness, but so did unsalted butter and cream, chosen for their fat, so the effect cannot be attributed to sugar or salt alone. [rows: Green 2010 Sucrose 0.56 M vs none; Nakamura 2002 Sucrose 750 mM vs none; Spinelli 2021 More vs less sucrose; Sugai 2026 Sweet or salty foods vs water]
Bitterness ratings at a glance
Human bitterness ratings. Values for "Group compared" and "Comparison" are as reported in the tables or text (values shown only in figures are marked as such, and values read by eye from a figure are marked as approximate). Besides taste-suppression rows, rows on removing salt and on mixing in foods are included and marked as such. For studies read only as abstracts, only the direction stated in the abstract is shown. Where no test is reported, the direction follows the reported values and should not be read as a significant difference. "Direction" shows which sample was more bitter; whether the difference is significant is shown by the test in the same "Direction / test" column. Select a study name to jump to its detailed table.
Results in which people rated bitterness only. Where each value comes from (a table or a reading from a figure) is shown in its row; scales and methods differ between studies, so compare within a row, not across rows.
| Study | Comparison and condition | Measured as | With addition | Without or with less | Direction / test |
|---|---|---|---|---|---|
| Kondoh 2026a | Across NaCl 5–80 mM NaCl added to caffeine, quinine and urea solutions (suppression) | reference-solution score (0 to −7, 10 people) | lower at higher concentrations (values only in a figure) | higher at lower concentrations (reference without NaCl = 0) | Without or with less more bitter Tested, significant |
| Kondoh 2026b | 0.1% NaCl vs none 4% L-histidine, no prior creatinine exposure (suppression) | mean±SD points of 10 allocated to bitter (12 people) | 3.92±1.51 | 6.58±1.44 | Without or with less more bitter Tested, significant |
| Okada 1997 | NaCl 0.25% and 0.5% vs none NaCl added to a bitter amino-acid solution (suppression) | Scheffé paired-comparison scores (32 people) | 0.25%, 0.5% (score sums for the difference from none: 50, 54) | none | Without or with less more bitter Tested, significant |
| Okada 1997 | Not desalted vs desalted Miso extract desalted (NaCl 1.2% → 0.02%); nitrogen compounds and pH also changed | number judging bitter in a paired test (8 people) | 1 (NaCl 1.2%) | 7 (NaCl 0.02%) | Without or with less more bitter Tested, significant |
| Nakamura 2002 | Sucrose 750 mM vs none Sucrose at 30, 150 and 750 mM added to 0.1 mM quinine hydrochloride (prepared in 10 mM KCl) (suppression) | bitterness score 0–4 (matched to quinine hydrochloride standards of 0.01–1 mM; higher is more bitter; mean of 11 people) | about 0.0 (approximate, from Fig. 1A) | about 1.65 (control without addition; approximate, from Fig. 1A) | Without or with less more bitter No test reported |
| Nakamura 2002 | NaCl 300 mM vs none NaCl at 30, 150 and 300 mM added to 0.1 mM quinine hydrochloride (prepared in 10 mM KCl) (suppression) | bitterness score 0–4 (matched to quinine hydrochloride standards of 0.01–1 mM; higher is more bitter; mean of 11 people) | about 0.28 (approximate, from Fig. 1A) | about 1.65 (control without addition; approximate, from Fig. 1A) | Without or with less more bitter No test reported |
| Green 2010 | Sucrose 0.56 M vs none Sucrose 0.56 M added to an aqueous 0.18 mM quinine sulphate solution (suppression) | mean of log10-transformed gLMS ratings (higher is more bitter; 35 people; approximate, from Fig. 1) | about 0.82 (approximate, from Fig. 1) | about 1.20 (quinine sulphate alone; approximate, from Fig. 1) | Without or with less more bitter Tested, significant |
| Green 2010 | NaCl 0.32 M vs none NaCl 0.32 M added to an aqueous 0.18 mM quinine sulphate solution (suppression) | mean of log10-transformed gLMS ratings (higher is more bitter; 35 people; approximate, from Fig. 1) | about 0.92 (approximate, from Fig. 1) | about 1.20 (quinine sulphate alone; approximate, from Fig. 1) | Without or with less more bitter Tested, not significant |
| Green 2010 | Sucrose and NaCl together vs none (not the effect of sugar or salt alone) Sucrose 0.56 M and NaCl 0.32 M together added to an aqueous 0.18 mM quinine sulphate solution (suppression) | mean of log10-transformed gLMS ratings (higher is more bitter; 35 people; approximate, from Fig. 1) | about 0.43 (approximate, from Fig. 1) | about 1.20 (quinine sulphate alone; approximate, from Fig. 1) | Without or with less more bitter Tested, significant |
| Spinelli 2021 | More vs less sucrose Chocolate pudding with the same cocoa at 4 sucrose levels (suppression) | gLMS (1138 analysed) | lower (values only in a figure) | values only in a figure | Without or with less more bitter Tested, significant |
| Mennella 2015 | With vs without sucrose Solutions of 5 bitterants, children and adults (suppression) | forced-choice paired comparison, plus gLMS for adults (abstract) | lower (abstract wording, no values) | values not in the abstract | Without or with less more bitter No test reported |
| Keast 2004 | With vs without sodium salts Bitterants alone and in binary mixtures (suppression) | not given (not in the abstract) | lower to differing degrees by bitterant, except tetralone (abstract wording) | values not in the abstract | Depends on the combination No test reported |
| Kido 2019 | Condensed milk, nori tsukudani vs water (screening) Herbal powder mixed with foods (whole foods, not sugar or salt alone) | mean on a 1–5 scale (20 people) | 2.8 (condensed milk), 2.1 (nori tsukudani) | 4.1 | Without or with less more bitter Tested, significant |
| Sugai 2026 | Sweet or salty foods vs water Bitter-gourd powder mixed with foods (whole foods, not sugar or salt alone) | median on an 11-point 0–10 scale (40 students, 23 teachers) | significantly lower (values only in a figure) | 8 (students), 6 (teachers) | Without or with less more bitter Tested, only some pairs significant |
Conditions and results, study by study
For each study, the conditions for the bitterant or food, what was added, serving and who rated it, and the results. Each row is one study × one measured result, so different comparisons in the same study are separate rows. Under each row we give where it is in the paper and whether it can be used to judge whether adding sugar or salt, with the bitter compound unchanged, lowers the bitterness people perceive, with the reason. Nothing is left blank: "not given", "not read" and "not applicable" are kept apart.
Kondoh 2026a sensory only
苦味に対する NaCl および塩化合物の抑制作用 (Suppression of bitterness by NaCl and various salts). 近畿大学農学部紀要 59:19-36 — doi:10.15100/0002004296
- How deeply checked
- Checked in full text — Full PDF from the university repository (Methods, Results, Figs 2–5); values only in figures, which were viewed but not transcribed into the table Checked by: LLM (one extracted, another checked against the source; no human check), 2026-10-21.
- Samples
- Aqueous bitterants: caffeine 30 mM, quinine hydrochloride 0.25 mM, urea 600 mM; added NaCl at 5, 10, 20, 40, 80 mM, other sodium salts, chloride salts (KCl, CaCl2, MgCl2; CaCl2, MgCl2 and Na2SO4 at half the compound concentration), salts with neither, NMDG salts, and sugars (sorbitol 90 mM, glucose 65 mM); sucrose not used
- Processing and cooking
- Not applicable (simply added to solutions)
- How it was served or eaten
- Room temperature, held 5 s and spat out; up to 10 samples a day
- Who rated, on what scale
- 10 female students with taste-test training; each sample matched against 8 reference solutions diluted in 1.2-fold steps, scored 0 to −7; two-way repeated-measures ANOVA with Bonferroni
| Measured | Comparison and condition | With addition | Without or with less | Unit | Direction / test |
|---|---|---|---|---|---|
| Bitterness intensity (sensory) | Across NaCl 5–80 mM NaCl added to caffeine, quinine and urea solutions (suppression) | lower at higher concentrations (values only in a figure) | higher at lower concentrations (reference without NaCl = 0) | reference-solution score (0 to −7, 10 people) | Without or with less more bitter Tested, significant |
| Effect of NaCl concentration across the 5 levels F(4,36)=111.406, P<.001; pairwise tests of each level against none are not reported. No significant difference by bitterant. Among other sodium salts no significant difference between salts was found. KCl, CaCl2 and MgCl2 gave only weak suppression (mean 1.0 or less at every level; CaCl2, MgCl2 and Na2SO4 were used at half the compound concentration). Sugars (sorbitol 90 mM, glucose 65 mM) also lowered scores significantly below 0 (P<.001) Where: Sections 3.1–3.4; Figs 2–5 For whether adding sugar or salt, with the bitter compound unchanged, lowers the bitterness people perceive: Usable — Bitterant held constant with only NaCl varied, and people compared bitterness | |||||
Kondoh 2026b sensory only
Pre-treatment with creatinine alters the perceived bitterness–sweetness balance of L-histidine in young Japanese female participants. Chemical Senses 2026:bjag025 — doi:10.1093/chemse/bjag025
- How deeply checked
- Checked in full text — Full text via Europe PMC (section on NaCl addition, Fig. 4) Checked by: LLM (one extracted, another checked against the source; no human check), 2026-10-21.
- Samples
- 4% L-histidine (258 mM) in water, with or without 0.1% NaCl (17 mM); with or without prior creatinine exposure (held 5 s and swallowed)
- Processing and cooking
- Not applicable (simply added to solutions)
- How it was served or eaten
- About 23 °C; 10 mL held 5 s and swallowed
- Who rated, on what scale
- 12 female students with taste training; 10 points allocated among bitter, sweet and other (allocation, not intensity); two-way repeated-measures ANOVA with Bonferroni (with vs without NaCl) and paired t-tests (bitter vs sweet)
| Measured | Comparison and condition | With addition | Without or with less | Unit | Direction / test |
|---|---|---|---|---|---|
| Bitterness dominance (sensory) | 0.1% NaCl vs none 4% L-histidine, no prior creatinine exposure (suppression) | 3.92±1.51 | 6.58±1.44 | mean±SD points of 10 allocated to bitter (12 people) | Without or with less more bitter Tested, significant |
| P<0.001 (ANOVA followed by Bonferroni); the sweet share rose from 3.33 to 4.25 (P<0.05). Because this is an allocation, not intensity, the author notes it cannot tell whether bitterness fell or sweetness rose Where: Section on NaCl addition; Fig. 4 For whether adding sugar or salt, with the bitter compound unchanged, lowers the bitterness people perceive: Limited — Only NaCl varied, but the measure is a 10-point allocation, not intensity | |||||
Okada 1997 sensory only
豆味噌の苦味に及ぼす食塩の影響 (Effect of Sodium Chloride on Bitterness of Desalted Soybean Miso). 日本食品科学工学会誌 44(4):259-264 — doi:10.3136/nskkk.44.259
- How deeply checked
- Checked in full text — Full PDF via J-STAGE (Tables 1–5 read from images) Checked by: LLM (one extracted, another checked against the source; no human check), 2026-10-21.
- Samples
- Varies by test: a mixture of 5 bitter amino acids (100 mg/100 mL each) with NaCl 0.25 or 0.5% (paired comparison); water-soluble fraction of unsalted miso with NaCl 0, 0.25, 0.5, 1.0% (ranking); separately, a miso extract desalted by electrodialysis (NaCl 1.2% → 0.02%)
- Processing and cooking
- Desalting also removed nitrogen compounds and lowered pH from 5.2 to 4.7
- How it was served or eaten
- Solutions (temperature not given)
- Who rated, on what scale
- Varies by test: ranking by 30 (researchers in their 20s–50s, Friedman test), paired comparison by 32 (Scheffé), paired test of desalting by 8; training not described
| Measured | Comparison and condition | With addition | Without or with less | Unit | Direction / test |
|---|---|---|---|---|---|
| Bitterness intensity (sensory) | NaCl 0.25% and 0.5% vs none NaCl added to a bitter amino-acid solution (suppression) | 0.25%, 0.5% (score sums for the difference from none: 50, 54) | none | Scheffé paired-comparison scores (32 people) | Without or with less more bitter Tested, significant |
| Bitterness ranked none > 0.25% > 0.5%, significant at the 1% level (Table 4); the score sum for 0.25% vs 0.5% was 14; in a ranking test of unsalted miso extract with NaCl 0–1.0% (30 people), bitterness tended to weaken with more NaCl from 0.25% (Table 3) Where: Tables 3 and 4 For whether adding sugar or salt, with the bitter compound unchanged, lowers the bitterness people perceive: Usable — Bitter amino acids held constant with only NaCl added | |||||
| Number choosing which is more bitter (sensory) | Not desalted vs desalted Miso extract desalted (NaCl 1.2% → 0.02%); nitrogen compounds and pH also changed | 1 (NaCl 1.2%) | 7 (NaCl 0.02%) | number judging bitter in a paired test (8 people) | Without or with less more bitter Tested, significant |
| The authors state the desalted extract was more bitter at the 5% level (test not named); desalting also removed nitrogen compounds and lowered pH, so this is not a comparison of NaCl alone Where: Table 1 For whether adding sugar or salt, with the bitter compound unchanged, lowers the bitterness people perceive: Limited — More people chose the desalted extract as bitter, but desalting also changed nitrogen compounds and pH, so the bitter content is not held constant; the count is of people choosing which was more bitter | |||||
Nakamura 2002 sensory only
The effect of various substances on the suppression of the bitterness of quinine-human gustatory sensation, binding, and taste sensor studies. Chemical & Pharmaceutical Bulletin — doi:10.1248/cpb.50.1589
- How deeply checked
- Checked in full text — Full 5-page PDF via J-STAGE (Methods, Results, Figs 1 and 2); values in Fig. 1A were read by eye from an enlarged page image (the paper has no table of values) Checked by: LLM (one extracted, another checked against the source; no human check), 2026-10-23.
- Samples
- 0.1 mM quinine hydrochloride (prepared in 10 mM KCl) with sucrose at 30, 150 and 750 mM or NaCl at 30, 150 and 300 mM added; aspartame, phosphatidic acid and tannic acid were also tested but are not in this table
- Processing and cooking
- Not applicable (simply added to solutions)
- How it was served or eaten
- 5 mL held in the mouth for 15 s; gargling and at least 20 min between samples
- Who rated, on what scale
- 11 people, who first learned quinine hydrochloride standards of 0.01, 0.03, 0.1, 0.3 and 1 mM as bitterness scores 0–4 and then scored the samples; figures show mean±SEM; no test method is given for the sucrose and NaCl comparisons
| Measured | Comparison and condition | With addition | Without or with less | Unit | Direction / test |
|---|---|---|---|---|---|
| Bitterness intensity (sensory) | Sucrose 750 mM vs none Sucrose at 30, 150 and 750 mM added to 0.1 mM quinine hydrochloride (prepared in 10 mM KCl) (suppression) | about 0.0 (approximate, from Fig. 1A) | about 1.65 (control without addition; approximate, from Fig. 1A) | bitterness score 0–4 (matched to quinine hydrochloride standards of 0.01–1 mM; higher is more bitter; mean of 11 people) | Without or with less more bitter No test reported |
| For the sucrose and NaCl comparisons, neither a test method nor a result is given in the text (error bars are SEM). Approximate values for the middle concentrations from the figure: about 1.45 at 30 mM and about 0.65 at 150 mM. A score of 0 corresponds to the bitterness of the 0.01 mM standard, not to no bitterness at all. The abstract says about 80% suppression required 800 mM (a value converted to concentration terms), which does not match the 750 mM in the Methods and figure. Tastes other than bitterness were not rated. The authors state that quinine does not bind sucrose (unbound quinine almost 100%), so the suppression is not by adsorption (data not shown) Where: Methods (Gustatory Sensation Study); Fig. 1A; Abstract For whether adding sugar or salt, with the bitter compound unchanged, lowers the bitterness people perceive: Limited — Bitterant (quinine hydrochloride) held constant with only sucrose added, and people rated bitterness; but no test result is given and the values are approximate readings from a figure. A test in solution, so it cannot be extended to other concentrations or foods | |||||
| Bitterness intensity (sensory) | NaCl 300 mM vs none NaCl at 30, 150 and 300 mM added to 0.1 mM quinine hydrochloride (prepared in 10 mM KCl) (suppression) | about 0.28 (approximate, from Fig. 1A) | about 1.65 (control without addition; approximate, from Fig. 1A) | bitterness score 0–4 (matched to quinine hydrochloride standards of 0.01–1 mM; higher is more bitter; mean of 11 people) | Without or with less more bitter No test reported |
| Neither a test method nor a result is given in the text (error bars are SEM). Approximate values for the middle concentrations from the figure: about 0.82 at 30 mM and about 0.55 at 150 mM. The abstract gives about 80% suppression at 300 mM (a value converted to concentration terms). Tastes other than bitterness (saltiness) were not rated. The authors state that quinine does not bind NaCl, so the suppression is not by adsorption (data not shown) Where: Methods (Gustatory Sensation Study); Fig. 1A; Abstract For whether adding sugar or salt, with the bitter compound unchanged, lowers the bitterness people perceive: Limited — Bitterant (quinine hydrochloride) held constant with only NaCl added, and people rated bitterness; but no test result is given and the values are approximate readings from a figure. A test in solution, so it cannot be extended to other concentrations or foods | |||||
Green 2010 sensory only
Taste mixture interactions: suppression, additivity, and the predominance of sweetness. Physiology & Behavior 101(5):731-737 — doi:10.1016/j.physbeh.2010.08.013
- How deeply checked
- Checked in full text — Full text of the author manuscript in PMC (PMC2975745; Methods, Results and Discussion); the Fig. 1 image was obtained and values read by eye Checked by: LLM (one extracted, another checked against the source; no human check), 2026-10-23.
- Samples
- Aqueous 0.56 M sucrose, 0.32 M NaCl, 10 mM citric acid and 0.18 mM quinine sulphate alone and in every binary, ternary and quaternary mixture; this table uses quinine sulphate alone and the mixtures adding sucrose, NaCl or both
- Processing and cooking
- Not applicable (solutions simply mixed)
- How it was served or eaten
- 5 mL at 37 °C sipped, swished for 2 s and spat out before rating (not swallowed); blocks with the nose open and closed were treated as replicates
- Who rated, on what scale
- Experiment 1: 35 people (aged 19–42) rated sweetness, saltiness, sourness and bitterness in that order on a gLMS; ratings were log10-transformed for repeated-measures ANOVA, with Tukey HSD for pairs. Experiment 2 (28 people) checked temperature and rating order
| Measured | Comparison and condition | With addition | Without or with less | Unit | Direction / test |
|---|---|---|---|---|---|
| Bitterness intensity (sensory) | Sucrose 0.56 M vs none Sucrose 0.56 M added to an aqueous 0.18 mM quinine sulphate solution (suppression) | about 0.82 (approximate, from Fig. 1) | about 1.20 (quinine sulphate alone; approximate, from Fig. 1) | mean of log10-transformed gLMS ratings (higher is more bitter; 35 people; approximate, from Fig. 1) | Without or with less more bitter Tested, significant |
| The overall test for bitterness was a repeated-measures ANOVA, F(7,245)=16.25, p<0.00001 (quinine sulphate alone and the 7 mixtures containing it). Pairwise tests used Tukey HSD; the text says the only binary mixture in which bitterness was significantly suppressed was the one with sucrose, and Fig. 1 marks it * (p<0.05). The figure legend does not say what the marks compare against; read with the text, we take it as against quinine sulphate alone (an inference). A difference in log values is not the percentage drop in bitterness. Detailed preparation of the mixtures and measured concentrations are not given in the text Where: Results and Discussion (Mixture Suppression); Fig. 1, bitterness panel For whether adding sugar or salt, with the bitter compound unchanged, lowers the bitterness people perceive: Usable — Bitterant (quinine sulphate) held constant with only sucrose added, and people rated bitterness; values are approximate readings from a figure, in solution | |||||
| Bitterness intensity (sensory) | NaCl 0.32 M vs none NaCl 0.32 M added to an aqueous 0.18 mM quinine sulphate solution (suppression) | about 0.92 (approximate, from Fig. 1) | about 1.20 (quinine sulphate alone; approximate, from Fig. 1) | mean of log10-transformed gLMS ratings (higher is more bitter; 35 people; approximate, from Fig. 1) | Without or with less more bitter Tested, not significant |
| The overall test for bitterness was a repeated-measures ANOVA, F(7,245)=16.25, p<0.00001 (quinine sulphate alone and the 7 mixtures containing it). With pairwise Tukey HSD (p<0.05), the text says the only binary mixture in which bitterness was significantly suppressed was the one with sucrose, and this bar carries no mark in Fig. 1. No significant suppression was detected for the mixture with NaCl, but its p value is not given. The reported value is lower with NaCl added; this does not mean there was no difference Where: Results and Discussion (Mixture Suppression); Fig. 1, bitterness panel For whether adding sugar or salt, with the bitter compound unchanged, lowers the bitterness people perceive: Usable — Bitterant (quinine sulphate) held constant with only NaCl added, and people rated bitterness; values are approximate readings from a figure, in solution | |||||
| Bitterness intensity (sensory) | Sucrose and NaCl together vs none (not the effect of sugar or salt alone) Sucrose 0.56 M and NaCl 0.32 M together added to an aqueous 0.18 mM quinine sulphate solution (suppression) | about 0.43 (approximate, from Fig. 1) | about 1.20 (quinine sulphate alone; approximate, from Fig. 1) | mean of log10-transformed gLMS ratings (higher is more bitter; 35 people; approximate, from Fig. 1) | Without or with less more bitter Tested, significant |
| A three-component mixture with sugar and salt added together; it does not show the effect of either alone. Fig. 1 marks it ** (p<0.01). The overall test for bitterness was a repeated-measures ANOVA, F(7,245)=16.25, p<0.00001 (quinine sulphate alone and the 7 mixtures containing it). The figure legend does not say what the marks compare against; we take it as against quinine sulphate alone (an inference). Whether it differs significantly from the mixture with sucrose only cannot be told from this mark. The text says sucrose and NaCl account for virtually all of the suppression of quinine bitterness Where: Results and Discussion (Mixture Suppression and the later paragraph on ternary mixtures); Fig. 1, bitterness panel For whether adding sugar or salt, with the bitter compound unchanged, lowers the bitterness people perceive: Limited — Bitterant held constant, but sugar and salt were added together, so the effect of each cannot be separated | |||||
Spinelli 2021 sensory only
Phenol-Rich Food Acceptability: The Influence of Variations in Sweetness Optima and Sensory-Liking Patterns. Nutrients 13(3):866 — doi:10.3390/nu13030866
- How deeply checked
- Checked in full text — Full text via Europe PMC (Methods 2.1–2.4, Results 3.1, Fig. 3); values only in Fig. 3, which was not viewed Checked by: LLM (one extracted, another checked against the source; no human check), 2026-10-21.
- Samples
- Chocolate pudding with the same cocoa (40 g/kg) and sucrose at 38, 83, 119, 233 g/kg (the figure legend gives 223 g/kg for the top level); no zero-sucrose control
- Processing and cooking
- Mixed with water, microwaved and refrigerated
- How it was served or eaten
- 15 g at room temperature, 1 spoonful swallowed after 10 s
- Who rated, on what scale
- 1208 untrained Italian consumers took part; 1138 assigned to 3 sweet-liking clusters were analysed (70 fell outside the clusters); bitterness on a gLMS; two-way ANOVA (cluster × concentration) with Bonferroni
| Measured | Comparison and condition | With addition | Without or with less | Unit | Direction / test |
|---|---|---|---|---|---|
| Bitterness intensity (sensory) | More vs less sucrose Chocolate pudding with the same cocoa at 4 sucrose levels (suppression) | lower (values only in a figure) | values only in a figure | gLMS (1138 analysed) | Without or with less more bitter Tested, significant |
| Effect of sucrose concentration F(3,4540)=654.99, p<0.0001; in all 3 sweet-liking clusters bitterness fell and sweetness rose with sucrose, with the size differing by cluster (interaction F(6,4540)=15.94); no zero-sucrose control Where: Results 3.1; Fig. 3 For whether adding sugar or salt, with the bitter compound unchanged, lowers the bitterness people perceive: Limited — Cocoa held constant with more vs less sucrose compared; with no zero-sucrose control it cannot be extended to adding sugar from none | |||||
Mennella 2015 sensory only
"A spoonful of sugar helps the medicine go down": bitter masking by sucrose among children and adults. Chemical Senses 40(1):17-25 — doi:10.1093/chemse/bju053
- How deeply checked
- Abstract only — Abstract only this time (the PMC page stopped at a verification screen and Europe PMC had no full-text XML; the ledger records an earlier full-text check) Checked by: LLM (one extracted, another checked against the source; no human check), 2026-10-21.
- Samples
- Sucrose added to 5 bitterants: urea, caffeine, denatonium benzoate, PROP, quinine (concentrations not in the abstract)
- Processing and cooking
- Not applicable (simply added to solutions)
- How it was served or eaten
- Not given (not in the abstract)
- Who rated, on what scale
- Children and adults; forced-choice paired comparison, and gLMS for adults; numbers not in the abstract
| Measured | Comparison and condition | With addition | Without or with less | Unit | Direction / test |
|---|---|---|---|---|---|
| Bitterness intensity (sensory) | With vs without sucrose Solutions of 5 bitterants, children and adults (suppression) | lower (abstract wording, no values) | values not in the abstract | forced-choice paired comparison, plus gLMS for adults (abstract) | Without or with less more bitter No test reported |
| The abstract says sucrose suppressed the bitterness of all 5 bitterants in both children and adults, with adults' ratings falling from moderate to weak, and that for caffeine and quinine the size of the drop differed by sweet-receptor genotype; values and tests not in the abstract Where: Abstract For whether adding sugar or salt, with the bitter compound unchanged, lowers the bitterness people perceive: Limited — The abstract reports sucrose added with bitterants held constant, but values, numbers and tests were not checked in full text this time | |||||
Keast 2004 sensory only
The influence of sodium salts on binary mixtures of bitter-tasting compounds. Chemical Senses 29(5):431-439 — doi:10.1093/chemse/bjh045
- How deeply checked
- Abstract only — Abstract only (full text paywalled) Checked by: LLM (one extracted, another checked against the source; no human check), 2026-10-21.
- Samples
- 5 bitterants alone and in binary mixtures, with sodium salts such as 100 mM NaCl, and sucrose
- Processing and cooking
- Not applicable (simply added to solutions)
- How it was served or eaten
- Not given (not in the abstract)
- Who rated, on what scale
- Panel size and scale not in the abstract
| Measured | Comparison and condition | With addition | Without or with less | Unit | Direction / test |
|---|---|---|---|---|---|
| Bitterness intensity (sensory) | With vs without sodium salts Bitterants alone and in binary mixtures (suppression) | lower to differing degrees by bitterant, except tetralone (abstract wording) | values not in the abstract | not given (not in the abstract) | Depends on the combination No test reported |
| The abstract says sodium salts suppressed bitterness to differing degrees by compound, not for tetralone or mixtures containing it, and that mixture bitterness was suppressed independently by sodium salts and sucrose Where: Abstract For whether adding sugar or salt, with the bitter compound unchanged, lowers the bitterness people perceive: Limited — The abstract reports sodium salts added with bitterants held constant, but values, numbers and tests were not checked in full text | |||||
Kido 2019 sensory only
食品による生薬製剤のマスキング効果. 日本食品化学学会誌 26(1):68-76 — doi:10.18891/jjfcs.26.1_68
- How deeply checked
- Checked in full text — Full text via J-STAGE (Results, Table 1, Figs 1–4) Checked by: LLM (one extracted, another checked against the source; no human check), 2026-10-21.
- Samples
- 1 g of a herbal powder (mainly zedoary) mixed with 20 mL water (control) or 20 mL / 20 g of a food; 30 foods (condensed milk, ice cream, peanut cream, nori tsukudani, miso soup and others)
- Processing and cooking
- Not applicable (simply mixed)
- How it was served or eaten
- 1 spoonful held 5 s and swallowed, then rinsed; ice cream kept cold, others at room temperature
- Who rated, on what scale
- There are 3 tests. Screening: 20 of 25 students and staff analysed (excluding 2 presumed to perceive little bitterness and 3 with missing data); 30 foods compared with the herbal preparation in water on a 1–5 bitterness scale with quinine standards. Confirmation in Fig. 3: the jelly for powdered drugs compared with the herbal preparation alone on the same 5-step scale (16 people). Main test (Fig. 4): 20 people selected from 39 by a five-taste identification test rated the jelly and 5 foods on a 9-point scale from −4 to +4 with the herbal preparation alone as 0, repeated 3 times. Tests were Wilcoxon signed-rank tests with Bonferroni correction (two-sided; some one-sided results are also given)
| Measured | Comparison and condition | With addition | Without or with less | Unit | Direction / test |
|---|---|---|---|---|---|
| Bitterness intensity (sensory) | Condensed milk, nori tsukudani vs water (screening) Herbal powder mixed with foods (whole foods, not sugar or salt alone) | 2.8 (condensed milk), 2.1 (nori tsukudani) | 4.1 | mean on a 1–5 scale (20 people) | Without or with less more bitter Tested, significant |
| Significantly lower than the water control (two-sided, after Bonferroni); 2 ice creams and peanut cream were also significantly lower, milk cocoa was not. The authors suggest the effective foods are strong-tasting and viscous and coat the powder, but did not test this Where: Results; Fig. 1 For whether adding sugar or salt, with the bitter compound unchanged, lowers the bitterness people perceive: Limited — Whole foods were compared, not sugar or salt alone (fat and viscosity also differ) | |||||
Sugai 2026 sensory only
服薬アドヒアランス向上を目的とした中学生の食品による苦味マスキング官能評価 (Sensory Evaluation of Food-Based Bitterness Masking in Junior High School Students Aimed at Improving Medication Adherence). 医療薬学 (Japanese Journal of Pharmaceutical Health Care and Sciences) 52(7):403-414 — doi:10.5649/jjphcs.52.403
- How deeply checked
- Checked in full text — Full text via J-STAGE (Results, Table 1, Figs 3 and 5); values per food only in figures, which were not viewed Checked by: LLM (one extracted, another checked against the source; no human check), 2026-10-21.
- Samples
- 1.0 g bitter-gourd powder mixed with room-temperature water (control) or 10 mL / 10 g of a food; 9 foods (chocolate syrup, condensed milk, sweet bean paste, nori tsukudani, miso soup, lemon juice, plain yogurt, cream, unsalted butter)
- Processing and cooking
- Not applicable (simply mixed)
- How it was served or eaten
- About 1 mL or 1 g held 5 s, normally spat out; same order for all, not blinded
- Who rated, on what scale
- 40 junior-high students and 23 teachers; bitterness on an 11-point 0–10 scale; Friedman test, Wilcoxon signed-rank tests with Holm correction
| Measured | Comparison and condition | With addition | Without or with less | Unit | Direction / test |
|---|---|---|---|---|---|
| Bitterness intensity (sensory) | Sweet or salty foods vs water Bitter-gourd powder mixed with foods (whole foods, not sugar or salt alone) | significantly lower (values only in a figure) | 8 (students), 6 (teachers) | median on an 11-point 0–10 scale (40 students, 23 teachers) | Without or with less more bitter Tested, only some pairs significant |
| For students 7 foods (chocolate syrup, nori tsukudani, miso soup, condensed milk, sweet bean paste, unsalted butter, cream) were significantly lower (P<0.001 after Holm), while lemon juice and plain yogurt were not; for teachers all 9 were. Unsalted butter and cream, chosen for their fat, also lowered bitterness Where: Results; Fig. 5 For whether adding sugar or salt, with the bitter compound unchanged, lowers the bitterness people perceive: Limited — Whole foods were compared, not sugar or salt alone; not blinded, same order for all | |||||
What was established within an experiment
Only results where the same panel compared changed conditions within one study.
- When the same 10 people compared caffeine, quinine and urea solutions with 5–80 mM NaCl, bitterness was lower at higher NaCl concentrations (concentration effect F(4,36)=111.406, P<.001); the difference by bitterant was not significant, and KCl, CaCl2 and MgCl2 gave only weak suppression (mean 1.0 or less at every concentration). [rows: Kondoh 2026a Across NaCl 5–80 mM]
- In a bitter amino-acid solution, bitterness ranked none > 0.25% > 0.5% NaCl (32 people, significant at the 1% level), and in unsalted miso extract bitterness tended to weaken with more NaCl from 0.25% (30 people). [rows: Okada 1997 NaCl 0.25% and 0.5% vs none]
- When the same 35 people compared the bitterness of 0.18 mM quinine sulphate alone and mixed with 0.56 M sucrose or 0.32 M NaCl, the overall test across quinine sulphate alone and the 7 mixtures containing it (including those with citric acid) was significant (F(7,245)=16.25, p<0.00001), and the only binary mixture in which bitterness was significantly suppressed in the pairwise tests was the one with sucrose (about 1.20 to about 0.82, p<0.05). No significant suppression was detected for the mixture with NaCl (about 0.92). The mixture with sucrose and NaCl added together was about 0.43 (p<0.01), but the effect of each cannot be separated. Values are approximate readings of log ratings from a figure. [rows: Green 2010 Sucrose 0.56 M vs none; Green 2010 NaCl 0.32 M vs none; Green 2010 Sucrose and NaCl together vs none (not the effect of sugar or salt alone)]
- In chocolate pudding with the same cocoa, raising sucrose over 4 levels lowered bitterness for the 1138 analysed (F(3,4540)=654.99, p<0.0001); it fell in all 3 sweet-liking clusters, but by different amounts (F(6,4540)=15.94). [rows: Spinelli 2021 More vs less sucrose]
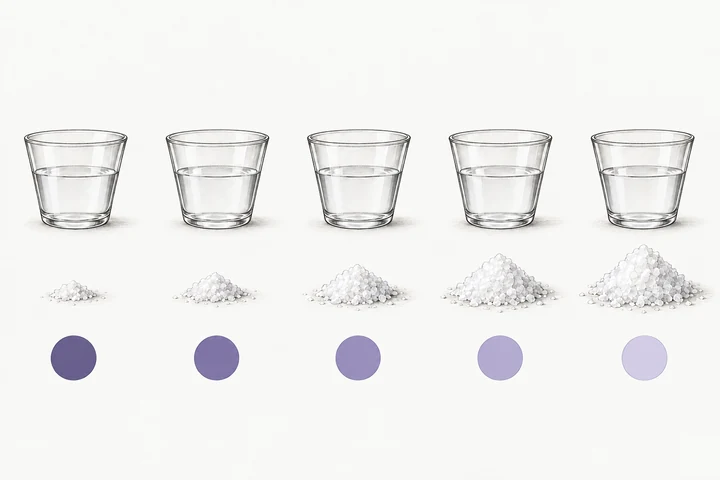
Salt added: less ← → more
A study in which table salt added to a liquid with the same amount of bitter compound lowered the rated bitterness the more salt was added. The size of the salt heaps and the shade of the purple marks show order only, not the ratio of salt or the size of the bitterness difference, and do not mean that each step differed significantly from the next. This was a test of salt in solution, not a picture of sugar or food. The purple is not a real colour.
Source: Kondoh et al. 2026 (Kondoh 2026a in the table of conditions and results by study)
Illustration: illustration desk (PurpleHeron)
Candidate explanations for the differences
Conditions that differ between studies, or between samples, and could explain differences in bitterness. Several conditions differ at once, so which one mattered is unknown. These are candidates, not causes.
- A candidate explanation for salt's effect is sodium suppressing bitterness, rather than saltiness itself: no significant difference was found between NaCl and other sodium salts, while KCl, CaCl2 and MgCl2 gave only weak suppression (mean 1.0 or less). This sensory comparison alone cannot identify where or how suppression occurs. The authors of the quinine study reported that quinine did not bind sucrose or NaCl in a binding test (data not shown in the paper) and also examined the effect with an artificial taste sensor, but this did not directly establish the mechanism or the contributions in people, so the mechanism in people is not settled. [rows: Kondoh 2026a Across NaCl 5–80 mM; Nakamura 2002 NaCl 300 mM vs none; Nakamura 2002 Sucrose 750 mM vs none]
- Besides taste-taste suppression, bitterness may drop because sweetness or another taste takes a larger share: for L-histidine, 0.1% NaCl lowered the bitter share from 6.58 to 3.92 and raised the sweet share from 3.33 to 4.25, but as an allocation it cannot show whether intensity fell. [rows: Kondoh 2026b 0.1% NaCl vs none]
- The effect of sugar or salt may depend on the amount added. In a quinine hydrochloride solution the bitterness score appeared to fall as sucrose rose through 30, 150 and 750 mM and NaCl through 30, 150 and 300 mM (approximate from a figure), but no test is reported; the authors write in the abstract that these worked at comparatively high concentrations. How far differences in amount, bitterant and scale account for NaCl appearing to work differently between studies was not tested in the included studies. [rows: Nakamura 2002 Sucrose 750 mM vs none; Nakamura 2002 NaCl 300 mM vs none; Green 2010 NaCl 0.32 M vs none; Kondoh 2026a Across NaCl 5–80 mM]
What is not known — what this comparison alone cannot separate
- Between studies the bitterants, amounts added, scales (reference-solution scores, bitterness scores, paired comparisons, log-transformed gLMS ratings, gLMS, allocation, choice counts) and panel sizes differ, so the size of the drop cannot be compared side by side. Rows with values read from figures are approximate, and some rows report no test. The desalted-miso comparison also changed nitrogen compounds and pH, so it cannot isolate the effect of salt; nor can the mixture with sugar and salt added together separate the effect of each. [rows: Kondoh 2026a Across NaCl 5–80 mM; Okada 1997 Not desalted vs desalted; Spinelli 2021 More vs less sucrose; Nakamura 2002 Sucrose 750 mM vs none; Green 2010 Sucrose 0.56 M vs none; Green 2010 Sucrose and NaCl together vs none (not the effect of sugar or salt alone)]
- Food-mixing tests change fat and viscosity along with sugar or salt, so which factor mattered cannot be separated; nor can they tell whether the bitter compound itself decreased or was merely perceived less. [rows: Kido 2019 Condensed milk, nori tsukudani vs water (screening); Sugai 2026 Sweet or salty foods vs water]
How studies and rows were counted
The number of evidence rows is not the number of studies. Table rows, ledger evidence rows, papers and research groups are counted separately.
- Sources in the table: 10, of which 10 have results on people's bitterness ratings in this table; for the others, only results on something else (compounds, smell) are shown, or they are used only for context.
- Rows in the table (study × measured result): 14. Rows on perceived bitterness: 14.
- Evidence rows in the lab's ledger these rows rest on: 0. One paper can supply several rows. Rows without a ledger evidence row come from other tables of the same papers, or from sources newly read for this question.
- Research groups among the studies with bitterness results in this table, as grouped in the ledger: 9 (reports from the same lab count as 1; co-authors and affiliations can overlap, so this is not a count of independent replications).
What we looked at
The sources examined for this question, why each was included or excluded, and which full texts could not be reached. We searched Europe PMC and J-STAGE for studies in which people compared bitterness with and without added sugar or salt, and added the sources already in the lab's ledger (CiNii was not searched). Where the full-text page stopped at a verification screen or was paywalled, the study is marked as read from the abstract only. Studies read only as abstracts whose abstracts give no values or tests were not made into numeric rows; what the abstract says and why are kept in this table.
| Source | Decision | Why |
|---|---|---|
| 苦味に対する NaCl および塩化合物の抑制作用 (Suppression of bitterness by NaCl and various salts) (2026) doi | Included in the table | NaCl and other salts added to bitterant solutions; read in full |
| Pre-treatment with creatinine alters the perceived bitterness–sweetness balance of L-histidine in young Japanese female participants (2026) doi | Included in the table | Partial experiment adding NaCl; read in full |
| 豆味噌の苦味に及ぼす食塩の影響 (Effect of Sodium Chloride on Bitterness of Desalted Soybean Miso) (1997) doi | Included in the table | Solutions with NaCl added and desalted extract; read in full |
| The effect of various substances on the suppression of the bitterness of quinine-human gustatory sensation, binding, and taste sensor studies (2002) doi | Included in the table | Sucrose and NaCl added to quinine hydrochloride; read in full, with values read by eye from Fig. 1A. Aspartame (a different sweetener) is not included (its middle concentrations differ between the text and the figure legend). Fig. 2 shows values converted to concentration terms and is not a separate row |
| Taste mixture interactions: suppression, additivity, and the predominance of sweetness (2010) doi | Included in the table | Mixtures adding sucrose or NaCl to quinine sulphate; read in full from the author manuscript in PMC, with values read by eye from Fig. 1. Mixtures that also contain citric acid (sour) are not included |
| Phenol-Rich Food Acceptability: The Influence of Variations in Sweetness Optima and Sensory-Liking Patterns (2021) doi | Included in the table | Pudding with sucrose varied at the same cocoa; read in full |
| "A spoonful of sugar helps the medicine go down": bitter masking by sucrose among children and adults (2015) doi | Included in the table | Sucrose added to solutions; abstract only this time |
| The influence of sodium salts on binary mixtures of bitter-tasting compounds (2004) doi | Included in the table | Sodium salts and sucrose added to solutions; abstract only |
| 食品による生薬製剤のマスキング効果 (2019) doi | Included in the table | Comparison of mixed-in foods; read in full |
| 服薬アドヒアランス向上を目的とした中学生の食品による苦味マスキング官能評価 (Sensory Evaluation of Food-Based Bitterness Masking in Junior High School Students Aimed at Improving Medication Adherence) (2026) doi | Included in the table | Comparison of mixed-in foods; read in full |
| Suppression of bitterness by sodium: variation among bitter taste stimuli (1995) doi | Read as context (not in the table) | Salts at 0–0.5 M added to bitterants such as urea and quinine. Read from the abstract only; values, panel size and tests are not in the abstract, so no numeric row. The abstract says salts suppressed bitterness in many combinations to differing degrees, that urea bitterness was suppressed by NaCl, Na acetate, Na gluconate and Li salts but not by KCl, and that the degree of suppression of urea bitterness was not explained by the saltiness of the salts alone |
| Sensory Quality of Functional Beverages: Bitterness Perception and Bitter Masking of Olive Leaf Extract Fortified Fruit Smoothies (2010) doi | Read as context (not in the table) | Sucrose, NaCl and Na cyclamate added to fruit smoothies fortified with olive leaf extract; read from the abstract only. The abstract says sucrose reduced perceived bitterness by 24.9% and NaCl did not effectively mask bitterness, but the amounts added, the ratings of both sides and test results are not in the abstract, so no numeric row; the baseline for the percentage cannot be confirmed from the abstract either |
| Binary taste mixture interactions in PROP non-tasters, medium-tasters and super-tasters (2001) doi | Full text not reachable | Sucrose–quinine and NaCl–quinine mixtures, a design within the question. The abstract reports quinine suppressing sweetness and similar results, but not whether sugar or salt lowered quinine bitterness. Full text not reached; on hold |
| Sodium Chloride Suppresses Vegetable Bitterness Only When Plain Vegetables Are Perceived as Highly Bitter (2014) doi | Full text not reachable | NaCl added to vegetables. Neither full text nor abstract is in the saved material this time (the publisher's page stopped at a verification screen); on hold. Values from third-party summaries are not copied |
| Sweet-bitter taste interactions in binary mixtures of sweeteners: Relationship between taste receptor activities and sensory perception (2024) doi | Full text not reachable | Bitter-tasting sweeteners (acesulfame K, saccharin) mixed with sugars such as sucrose or other sweeteners. Whether the bitter compound was held constant cannot be confirmed from the abstract, and the full text was not reached; on hold |
| Sweetness-independent bitterness suppression of rebaudioside A by sucrose in a cocoa model (2026) doi | Excluded | In a cocoa model, sucrose and rebaudioside A were presented mixed or separately on the two sides of the tongue. Both conditions contain sucrose, so it is not an added vs not-added comparison; a reference on presentation and mechanism only |
| 閾値以下の苦味はうま味強度と後味に影響を与えた (2011) doi | Excluded | A conference abstract measuring umami intensity and aftertaste when subthreshold bitterants were added, not a study adding sugar or salt and measuring bitterness |
| Interactions in caffeine–sucrose and coffee–sucrose mixtures: evidence of taste and flavor suppression (1990) doi | Full text not reachable | Caffeine–sucrose mixtures; neither full text nor abstract obtained |
| Consumer Rejection Threshold of Mung Bean Protein Hydrolysate: Unsweetened and Sweetened Brewed Teas as Test Models (2026) doi | Excluded | Sucrose raised the acceptance threshold, but acceptance and liking were measured, not bitterness intensity |
| Saltiness and Bitterness Perception of KCl-Based Mixed Salts (KCl/NaCl/L-Arginine) Evaluated by the R-Index and Partial Projective Mapping Methods (2026) doi | Excluded | The KCl/NaCl ratio changed together and L-arginine was also present, so it is not a comparison varying only NaCl with the bitter content fixed |
Read in the encyclopedia
- Taste-mixture suppression — one taste weakening another
- Sodium chloride — the salt added
- Do oil or mayonnaise soften green pepper bitterness? — a comparison of oil and dairy
- Does cheese bitterness change with ripening and the choice of starter bacteria? — a comparison page in the same format
Source ledger
Each study's source can be reached from its section above. All of the lab's sources are listed in the source ledger.
How to cite this page
Aoki, M. (NIGAMI LAB) (2026). Does adding sugar or salt suppress bitterness?. https://nigamilab.com/en/topics/sugar-salt-suppression/
Each claim card has a stable anchor (#clm-…). The dataset is CC BY 4.0; see the data page. Dataset DOI: 10.5281/zenodo.22739101