Topic hub — 2026-10-21
Is chocolate with a higher cocoa percentage more bitter?
The higher the cocoa percentage, the more bitter the chocolate: that is how the number on the wrapper is often read. What do studies in which people actually tasted chocolate say? This page lines up the included studies together with their conditions: the samples (cocoa, sugar, fat), processing such as roasting or alkalisation, and who rated them on what scale, alongside studies of compounds said to relate to bitterness (theobromine, polyphenols). It then separates what was established within one experiment, what differences between studies might explain, and what this comparison alone cannot separate.
On this page (10 sections)
- What this page establishes
- What the included studies allow us to say
- Bitterness ratings at a glance
- Conditions and results, study by study
- What was established within an experiment
- Candidate explanations for the differences
- What is not known — what this comparison alone cannot separate
- How studies and rows were counted
- What we looked at
- Read in the encyclopedia
What this page establishes
- That a commercial bar with more cocoa was rated more bitter in one study, but the bars compared also differed in sugar and fats.
- That in the sources searched, no full paper had people compare bitterness with only cocoa content changed.
- That even at fixed cocoa content, sugar, bean origin and processing move bitterness a lot.
- That compounds said to relate to bitterness rise with labelled cocoa content, but no study measured compounds and bitterness on the same samples.
What the included studies allow us to say
- In one study a commercial bar with more cocoa was rated more bitter: median bitterness was 7.45 for an 85% bar and 2 for a 36% bar. But the 2 bars also differ in sugar, fats and ingredients, and in the sources searched no full paper had people compare bitterness with only cocoa content changed. [rows: Wagner 2023 85% vs 36%]
- Bitterness moves a lot even at fixed cocoa content: in a drink with the same cocoa powder, raising sugar from 0 to 5% lowered bitterness from 10.6 to 5.3, and 54 bars of one recipe ranged from 2.750 to 6.750. Theobromine rises with labelled cocoa content (r=0.836), but that study did not measure bitterness. [rows: Pedersen 2023 sugar; Guzmán Penella 2023 54 bars of one recipe; Altissimo 2026 labelled cocoa content]
Bitterness ratings at a glance
Human bitterness ratings and levels of compounds said to relate to bitterness. Values for "Sample compared" and "Comparison" are as reported in the tables or figures (values read from figures are marked as estimates). "Direction" shows which sample was more bitter; gaps the paper does not treat as a difference are shown as "about the same". Select a study name to jump to its detailed table.
Results in which people rated bitterness only. Where each value comes from (a table or a reading from a figure) is shown in its row; scales and methods differ between studies, so compare within a row, not across rows.
| Study | Comparison and condition | Measured as | Sample compared | Comparison | Direction / test |
|---|---|---|---|---|---|
| Wagner 2023 | 85% vs 36% Commercial 85% cocoa bar vs 36% bar | median, 10-point category scale (39 people) | 7.45 (IQR 2.2) | 2 (IQR 3) | Sample compared more bitter Tested, significant |
| Pedersen 2023 | sugar Cocoa powder 3%, sugar 0% vs 2.5% and 5% (means pooled over 2 milk-fat levels) | 15 cm line scale (11 people) | 10.6 (0%) | 8.2 (2.5%), 5.3 (5%) | Sample compared more bitter Tested, significant |
| Pedersen 2023 | milk fat Cocoa powder 3%, milk fat 0.1% vs 4.5% (means pooled over 4 sweetener conditions) | 15 cm line scale (11 people) | 7.7 (0.1%) | 7.2 (4.5%) | About the same Tested, not significant |
| Caponio 2020 | both labelled 70% Artisanal vs industrial (both labelled 70%) | sensory score (50 people; the scale used for bitterness cannot be confirmed from the text) | significantly higher (values only in a figure) | values only in a figure | Sample compared more bitter Tested, significant |
| McClure 2022 | roasting temperature Roasting temperature 1 SD (42 °C) higher vs the mean | gLMS (145 people) | 1.56 below the mean of 26.9 (authors' conversion) | 26.9 (mean) | Comparison more bitter Tested, significant |
| Juvinal 2023 | alkalisation Alkalised vs natural powder (trial samples) | bitter aftertaste, 15 cm line (8 people) | 2.9 | 2.4 | Sample compared more bitter Tested, significant |
| Guzmán Penella 2023 | 54 bars of one recipe Highest vs lowest among 54 bars of one recipe (60% cocoa liquor) | 0–10 (mean of 8 panellists) | 6.750 | 2.750 | Sample compared more bitter No test reported |
| Ishikawa 2019 | bean origin Ecuador vs Ghana and Venezuela (same recipe) | 7 points, −3 to +3 (53 people) | 1.3 | 0.5 (Ghana), 0.5 (Venezuela) | Sample compared more bitter Tested, significant |
| Kasai 2007 | correlation with compounds Bitterness scores against compounds across chocolates from 7 origins | correlation coefficient | r = 0.87 (polyphenols) | r = 0.05 (caffeine), −0.32 (theobromine) | Sample compared higher Tested, only some pairs significant |
Conditions and results, study by study
For each study, the conditions for the samples, processing, how they were eaten and the rating, and the results. Each row is one study × one measured result, so different comparisons in the same study are separate rows. Under each row we give where it is in the paper and whether it can be used to judge whether a higher cocoa percentage makes people perceive more bitterness, with the reason. Nothing is left blank: "not given", "not read" and "not applicable" are kept apart.
Wagner 2023 sensory only
Sensory and affective response to chocolate differing in cocoa content: A TDS and facial electromyography approach. Physiology & Behavior 270:114308 — doi:10.1016/j.physbeh.2023.114308
- How deeply checked
- Checked in full text — Full PDF from the institutional repository (Table 1, Results 3.1, Fig. 1) Checked by: LLM (one extracted, another checked against the source; no human check), 2026-10-21.
- Samples
- 2 commercial bars: 36% cocoa (sugar listed first, with vegetable fats) and 85% cocoa (cocoa mass and fat-reduced cocoa first); sugar by weight not given
- Processing and cooking
- As sold (processing not given)
- How it was served or eaten
- 5 g eaten as is
- Who rated, on what scale
- 39 untrained people; each sample twice, rating bitterness and liking on 10-point categories after TDS; Wilcoxon and paired t-tests
| Measured | Comparison and condition | Sample compared | Comparison | Unit | Direction / test |
|---|---|---|---|---|---|
| Bitterness intensity (sensory) | 85% vs 36% Commercial 85% cocoa bar vs 36% bar | 7.45 (IQR 2.2) | 2 (IQR 3) | median, 10-point category scale (39 people) | Sample compared more bitter Tested, significant |
| Z=5.36, p<0.001; the 2 bars also differ in sugar, fats and ingredients, so the gap cannot be attributed to cocoa content alone; liking 4.4 for 85% and 6.29 for 36% Where: Results 3.1 and Table 1, pp. 3–4 For whether a higher cocoa percentage makes people perceive more bitterness: Limited — People compared 2 bars of different cocoa content with a test, but it is 1 pair of commercial bars that also differ in sugar, fats and ingredients | |||||
Pedersen 2023 sensory only
Sensory Interactions between Sweetness and Fat in a Chocolate Milk Beverage. Foods — doi:10.3390/foods12142711
- How deeply checked
- Checked in full text — Full text via Europe PMC (Tables 1 and 3) Checked by: LLM (one extracted, another checked against the source; no human check), 2026-10-21.
- Samples
- Trial chocolate milk with cocoa powder fixed at 3%
- Processing and cooking
- Milk fat 0.1% or 4.5% × 4 sweetener conditions (sugar 0, 2.5 or 5%, and 2.5% sugar with 0.015% acesulfame K)
- How it was served or eaten
- Served at 8 °C
- Who rated, on what scale
- 11 trained panellists; 15 cm line scale, 3 replicates; mixed-model ANOVA and Tukey test
| Measured | Comparison and condition | Sample compared | Comparison | Unit | Direction / test |
|---|---|---|---|---|---|
| Bitterness intensity (sensory) | sugar Cocoa powder 3%, sugar 0% vs 2.5% and 5% (means pooled over 2 milk-fat levels) | 10.6 (0%) | 8.2 (2.5%), 5.3 (5%) | 15 cm line scale (11 people) | Sample compared more bitter Tested, significant |
| The 3 levels differed significantly from each other (main effect of the 4 sweetener conditions p<0.0001); bitter aftertaste also 9.9, 7.2, 5.1 Where: Table 3 For whether a higher cocoa percentage makes people perceive more bitterness: Limited — Sugar alone varied with cocoa powder fixed; cocoa content not varied, and the result is for a drink | |||||
| Bitterness intensity (sensory) | milk fat Cocoa powder 3%, milk fat 0.1% vs 4.5% (means pooled over 4 sweetener conditions) | 7.7 (0.1%) | 7.2 (4.5%) | 15 cm line scale (11 people) | About the same Tested, not significant |
| p=0.249, not significant (which does not mean the same) Where: Table 3 For whether a higher cocoa percentage makes people perceive more bitterness: Limited — Fat alone varied, but in a drink | |||||
Caponio 2020 sensory only
Chemical Characterization, Gastrointestinal Motility and Sensory Evaluation of Dark Chocolate: A Nutraceutical Boosting Consumers’ Health. Nutrients 12(4):939 — doi:10.3390/nu12040939
- How deeply checked
- Checked in full text — Full text via Europe PMC (Tables 3 and 4, Results 5.2); bitterness values only in Fig. 4, which was not viewed Checked by: LLM (one extracted, another checked against the source; no human check), 2026-10-21.
- Samples
- 2 dark chocolates both labelled 70%, artisanal and industrial (2 lots each); sugar and bean origin not given
- Processing and cooking
- As sold
- How it was served or eaten
- Eaten as is
- Who rated, on what scale
- 50 healthy adults; 0–100 mm line and 1–5 scales; t-test
| Measured | Comparison and condition | Sample compared | Comparison | Unit | Direction / test |
|---|---|---|---|---|---|
| Bitterness intensity (sensory) | both labelled 70% Artisanal vs industrial (both labelled 70%) | significantly higher (values only in a figure) | values only in a figure | sensory score (50 people; the scale used for bitterness cannot be confirmed from the text) | Sample compared more bitter Tested, significant |
| Carbohydrate, fat, total polyphenols and others did not differ significantly; theobromine was higher in the industrial bar (1239 vs 1437 µg/g, p=0.02) Where: Results 5.2, Tables 3 and 4 For whether a higher cocoa percentage makes people perceive more bitterness: Limited — An example of different bitterness at the same 70% label; values only in a figure, 2 products × 2 lots | |||||
Altissimo 2026 composition only
Chromatographic Profiling of Artisanal Chocolates: Volatile Composition and Methylxanthines as Markers of Cocoa Content. Journal of Food Science 91(3):e70979 — doi:10.1111/1750-3841.70979
- How deeply checked
- Checked in full text — Full text via Europe PMC (Table 3, correlation and regression); the cocoa range is 36–100% in the abstract but groups of 30–65% and 70–100% in the text Checked by: LLM (one extracted, another checked against the source; no human check), 2026-10-21.
- Samples
- 45 artisanal chocolates from small Brazilian makers; cocoa content is the label value, not measured independently; sugar and milk not given
- Processing and cooking
- As sold
- How it was served or eaten
- Not applicable (no human tasting)
- Who rated, on what scale
- No human evaluation; theobromine and caffeine measured by HPLC
| Measured | Comparison and condition | Sample compared | Comparison | Unit | Direction / test |
|---|---|---|---|---|---|
| Theobromine | labelled cocoa content Labelled 70–100% group vs 30–65% group | 12.43 ± 3.60 | 5.86 ± 3.40 | g/kg, mean ± SD | Sample compared higher No test reported |
| No test of the 2-group difference; the regressions on labelled cocoa content were significant, with r=0.836 for theobromine and r=0.811 for caffeine (group means 1.08 vs 0.45 g/kg); bitterness was not measured Where: Table 3, Results For whether a higher cocoa percentage makes people perceive more bitterness: Not usable — Compound levels, not human bitterness; cocoa content is the label value | |||||
McClure 2022 sensory only
Optimizing consumer acceptability of 100% chocolate through roasting treatments and effects on bitterness and other important sensory characteristics. Current Research in Food Science — doi:10.1016/j.crfs.2022.01.005
- How deeply checked
- Checked in full text — Full text via Europe PMC (Table 1A, Results 3.1) Checked by: LLM (one extracted, another checked against the source; no human check), 2026-10-21.
- Samples
- 100% chocolate from beans of Madagascar, Ghana and Peru (no added sugar or other ingredients); cocoa content not varied
- Processing and cooking
- Roasting: 8 conditions plus replicated centre points applied to 3 origins, 27 treatments in all (including an unroasted control; 24–171 °C, 0–80 min)
- How it was served or eaten
- Discs of about 0.3 g
- Who rated, on what scale
- 145 consumers recruited (brief training on day 1); each sample rated by 104 people on average, 148 ratings; gLMS; mixed-effects model on square-root values
| Measured | Comparison and condition | Sample compared | Comparison | Unit | Direction / test |
|---|---|---|---|---|---|
| Bitterness intensity (sensory) | roasting temperature Roasting temperature 1 SD (42 °C) higher vs the mean | 1.56 below the mean of 26.9 (authors' conversion) | 26.9 (mean) | gLMS (145 people) | Comparison more bitter Tested, significant |
| The temperature coefficient was significant (−0.1529 on the square-root scale), and so was the time × temperature interaction, so the decrease depends on roasting time; 100% chocolate, cocoa content not varied; origin means Peru 28.1, Ghana 26.0, Madagascar 26.8 Where: Table 1A, Results 3.1 For whether a higher cocoa percentage makes people perceive more bitterness: Limited — Not a direct cocoa-content comparison (a roasting comparison); usable as an example of bitterness moving at fixed cocoa content | |||||
Juvinal 2023 sensory only
Physico-Chemical Property, Sensory Profile and Consumer Acceptability of Water Buffalo (Bubalus bubalis L.) Chocolate Milk Using Alkalized and Natural Cocoa Powder. Foods 12(9):1797 — doi:10.3390/foods12091797
- How deeply checked
- Checked in full text — Full text via Europe PMC (Tables 2, 4 and 6); the abstract does not list bitter aftertaste among the discriminating attributes, but Table 4 shows a significant difference Checked by: LLM (one extracted, another checked against the source; no human check), 2026-10-21.
- Samples
- Water-buffalo chocolate milk: 2 trial samples with 1% cocoa powder and 7.5% sugar, plus 2 commercial ones
- Processing and cooking
- Alkalised vs natural cocoa powder (different brands, also differing in pH, fat and ash)
- How it was served or eaten
- Served at 4 °C
- Who rated, on what scale
- 8 trained panellists (15 cm line, 4 replicates; 3-way ANOVA of product, panellist and replicate with Tukey test, 5% level) and 120 consumers (9-point liking)
| Measured | Comparison and condition | Sample compared | Comparison | Unit | Direction / test |
|---|---|---|---|---|---|
| Bitterness intensity (sensory) | alkalisation Alkalised vs natural powder (trial samples) | 2.9 | 2.4 | bitter aftertaste, 15 cm line (8 people) | Sample compared more bitter Tested, significant |
| The powders were different brands also differing in pH, fat and ash; the 2 commercial samples (alkalised and natural) were both 1.8 Where: Tables 2 and 4 For whether a higher cocoa percentage makes people perceive more bitterness: Limited — Not a direct cocoa-content comparison; alkalisation cannot be separated from the powder brand, but usable as an example of processing changing bitter aftertaste | |||||
Guzmán Penella 2023 sensory only
Link between Flavor Perception and Volatile Compound Composition of Dark Chocolates Derived from Trinitario Cocoa Beans from Dominican Republic. Molecules 28(9):3805 — doi:10.3390/molecules28093805
- How deeply checked
- Checked in full text — Full text via Europe PMC (Appendix Table A1) Checked by: LLM (one extracted, another checked against the source; no human check), 2026-10-21.
- Samples
- 54 chocolates from Trinitario beans of one fermentation campaign, all at 60% cocoa liquor, 30% sugar and 10% cocoa butter
- Processing and cooking
- Fermentation, roasting and refining conditions undisclosed
- How it was served or eaten
- Eaten as is
- Who rated, on what scale
- 13 trained panellists; 0–10 scores, with means from the 8 most discriminating panellists
| Measured | Comparison and condition | Sample compared | Comparison | Unit | Direction / test |
|---|---|---|---|---|---|
| Bitterness intensity (sensory) | 54 bars of one recipe Highest vs lowest among 54 bars of one recipe (60% cocoa liquor) | 6.750 | 2.750 | 0–10 (mean of 8 panellists) | Sample compared more bitter No test reported |
| Mean across 54 bars 4.108, SD 0.991; fermentation, roasting and refining undisclosed Where: Appendix Table A1 For whether a higher cocoa percentage makes people perceive more bitterness: Limited — Shows how much bitterness varies at fixed cocoa content; conditions undisclosed, no test | |||||
Ishikawa 2019 sensory only
TI・TDS 法によるカカオ豆の異なるビターチョコレートの呈味特性. 日本官能評価学会誌 23(1):14-25 — doi:10.9763/jjsse.23.14
- How deeply checked
- Checked in full text — Full text of the J-STAGE PDF (Table 1, Fig. 1); figure values are printed labels Checked by: LLM (one extracted, another checked against the source; no human check), 2026-10-21.
- Samples
- 3 trial bitter chocolates (beans from Ghana, Ecuador and Venezuela), all 40% cocoa mass, 20% cocoa butter and 39.7% sugar
- Processing and cooking
- Roasted 60 min at 120–130 °C
- How it was served or eaten
- 2 g licked without chewing, rated with nose clips
- Who rated, on what scale
- 10 trained panellists and 43 female students; 7 points from −3 to +3 (both panels combined); Tukey test
| Measured | Comparison and condition | Sample compared | Comparison | Unit | Direction / test |
|---|---|---|---|---|---|
| Bitterness intensity (sensory) | bean origin Ecuador vs Ghana and Venezuela (same recipe) | 1.3 | 0.5 (Ghana), 0.5 (Venezuela) | 7 points, −3 to +3 (53 people) | Sample compared more bitter Tested, significant |
| Ecuador was significantly higher than the other 2 (Tukey, 5% level); the 4 measures derived from the time-intensity curves (10 people) showed no significant difference Where: Fig. 1, p. 19 For whether a higher cocoa percentage makes people perceive more bitterness: Limited — Cocoa content and sugar fixed, varying only origin; not a cocoa-content comparison | |||||
Kasai 2007 sensory only
カカオ豆産地とチョコレートのおいしさとの関係. 日本食品科学工学会誌 54(7):332-338 — doi:10.3136/nskkk.54.332
- How deeply checked
- Checked in full text — Full text of the J-STAGE PDF (Tables 1, 2, 4 and 5); the PDF text is garbled, so page images were transcribed; the abstract and text give different panel sizes Checked by: LLM (one extracted, another checked against the source; no human check), 2026-10-21.
- Samples
- 7 trial chocolates (beans from 7 origins), all 40% cocoa mass, 20% cocoa butter and 39.7% sugar
- Processing and cooking
- Roasted 80 min at 110 °C; conched 19 h at 80 °C and 1 h at 50 °C, then kept 2 weeks at 18 °C
- How it was served or eaten
- 5 g eaten as is
- Who rated, on what scale
- 12 trained women (text; the abstract says 20); 7 points from −3 to +3 against Ghana as 0, 2 replicates; ANOVA and Tukey test
| Measured | Comparison and condition | Sample compared | Comparison | Unit | Direction / test |
|---|---|---|---|---|---|
| Bitterness intensity (sensory) | correlation with compounds Bitterness scores against compounds across chocolates from 7 origins | r = 0.87 (polyphenols) | r = 0.05 (caffeine), −0.32 (theobromine) | correlation coefficient | Sample compared higher Tested, only some pairs significant |
| Significant for polyphenols (1% level); no significant correlation was shown for caffeine or theobromine; what n the correlations used is not stated; bitterness scores ranged from 1.75 (Sulawesi) to −0.04 (Carenero), with Ghana as 0 Where: Tables 2, 4 and 5 For whether a higher cocoa percentage makes people perceive more bitterness: Limited — A correlation across 7 origins at fixed cocoa content; compounds and bitterness from the same samples, but cocoa content not varied | |||||
What was established within an experiment
Only results where the same panel compared changed conditions within one study.
- When 39 people compared commercial 85% and 36% bars, median bitterness was 7.45 vs 2, a significant difference (p<0.001), and liking was lower for the 85% bar (4.4 vs 6.29). [rows: Wagner 2023 85% vs 36%]
- In chocolate milk with 3% cocoa powder, bitterness fell significantly with sugar at 0, 2.5 and 5% (10.6, 8.2, 5.3); between 0.1% and 4.5% milk fat it was 7.7 vs 7.2, not significant. [rows: Pedersen 2023 sugar; Pedersen 2023 milk fat]
- Between artisanal and industrial bars both labelled 70%, the artisanal bar scored significantly more bitter; total polyphenols and others did not differ significantly, and theobromine was in fact higher in the industrial bar (1239 vs 1437 µg/g). [rows: Caponio 2020 both labelled 70%]
- Across 45 artisanal chocolates, theobromine (r=0.836) and caffeine (r=0.811) rose with labelled cocoa content (no human evaluation). [rows: Altissimo 2026 labelled cocoa content]
- With the same recipe (60% cocoa, 39.7% sugar) and only the bean origin changed, Ecuador (1.3) was significantly more bitter than Ghana and Venezuela (0.5). [rows: Ishikawa 2019 bean origin]
- In 100% chocolate with no added sugar, higher roasting temperature lowered bitterness (1.56 below the mean of 26.9 per 1 SD, 42 °C, by the authors' conversion), but an interaction with time means the decrease depends on roasting time. [rows: McClure 2022 roasting temperature]
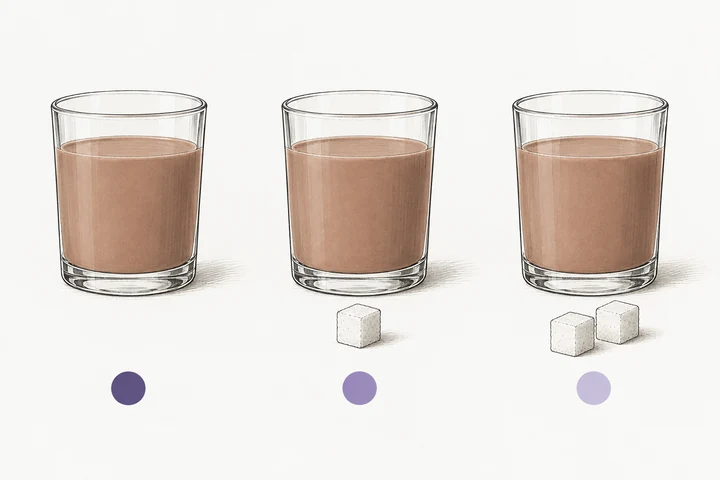
No sugar
Some sugar
More sugar
A study in which chocolate milk with the same amount of cocoa powder was rated less bitter as only the sugar was increased. The same colour in each glass shows the cocoa is the same. The number of sugar cubes and the shade of the purple marks show order only, not the amount of sugar or the size of the bitterness difference. The purple is not a real colour. This test did not change the cocoa percentage.
Source: Pedersen et al. 2023 (Pedersen 2023 in the table of conditions and results by study)
Illustration: illustration desk (PurpleHeron)
Candidate explanations for the differences
Conditions that differ between studies, or between samples, and could explain differences in bitterness. Several conditions differ at once, so which one mattered is unknown. These are candidates, not causes.
- Sugar. Bars with more cocoa often have less sugar, but sugar in the commercial bars was not measured. In a drink where only sugar changed at fixed cocoa powder, bitterness roughly halved (10.6 to 5.3), so differences between commercial bars of different cocoa content may include a sugar difference. [rows: Pedersen 2023 sugar; Wagner 2023 85% vs 36%]
- Beans and processing. Bitterness scores spread from 2.750 to 6.750 across 54 bars of one recipe, differed by origin alone at the same recipe (1.3 vs 0.5), and moved with roasting temperature. Factors the label number does not capture, such as processing, are candidates, but the cause of the spread across 54 bars was not separated. [rows: Guzmán Penella 2023 54 bars of one recipe; Ishikawa 2019 bean origin; McClure 2022 roasting temperature]
- Polyphenols. Across 7 origins at the same recipe, more polyphenols went with more bitterness (r=0.87), while no significant correlation was shown for caffeine or theobromine; this is a correlation, not evidence of cause. [rows: Kasai 2007 correlation with compounds]
What is not known — what this comparison alone cannot separate
- Cocoa content itself versus sugar: no included study varied cocoa and sugar separately with people rating bitterness, so which one drives differences between commercial bars cannot be separated. [rows: Wagner 2023 85% vs 36%; Pedersen 2023 sugar]
- Whether compounds explain bitterness: among the included studies, none measured both bitterness and compounds on samples of varied cocoa content; higher compound levels and stronger bitterness come from separate studies (those measuring both kept cocoa content fixed). [rows: Altissimo 2026 labelled cocoa content; Wagner 2023 85% vs 36%]
- Bitterness versus liking: the more bitter bar was also liked less, but both were rated in the same tasting, so whether liking leaks into the bitterness rating cannot be separated. [rows: Wagner 2023 85% vs 36%]
How studies and rows were counted
The number of evidence rows is not the number of studies. Table rows, ledger evidence rows, papers and research groups are counted separately.
- Sources in the table: 9, of which 8 have results on people's bitterness ratings in this table; for the others, only results on something else (compounds, smell) are shown, or they are used only for context.
- Rows in the table (study × measured result): 10. Rows on perceived bitterness: 9.
- Evidence rows in the lab's ledger these rows rest on: 0. One paper can supply several rows. Rows without a ledger evidence row come from other tables of the same papers, or from sources newly read for this question.
- Research groups among the studies with bitterness results in this table, as grouped in the ledger: 8 (reports from the same lab count as 1; co-authors and affiliations can overlap, so this is not a count of independent replications).
What we looked at
The sources examined for this question, why each was included or excluded, and which full texts could not be reached. We searched Europe PMC and J-STAGE for studies on sensory bitterness of chocolate or cocoa and cocoa content, sugar, fat, roasting or alkalisation, and added the sources already in the lab's ledger (CiNii was not searched).
| Source | Decision | Why |
|---|---|---|
| Sensory and affective response to chocolate differing in cocoa content: A TDS and facial electromyography approach (2023) doi | Included in the table | People compared bitterness of 2 bars of different cocoa content; read in full |
| Sensory Interactions between Sweetness and Fat in a Chocolate Milk Beverage (2023) doi | Included in the table | Varied sugar and fat with cocoa powder fixed; read in full |
| Chemical Characterization, Gastrointestinal Motility and Sensory Evaluation of Dark Chocolate: A Nutraceutical Boosting Consumers’ Health (2020) doi | Included in the table | Bitterness and compounds of 2 bars labelled 70%; read in full |
| Chromatographic Profiling of Artisanal Chocolates: Volatile Composition and Methylxanthines as Markers of Cocoa Content (2026) doi | Included in the table | Labelled cocoa content against compounds; read in full |
| Optimizing consumer acceptability of 100% chocolate through roasting treatments and effects on bitterness and other important sensory characteristics (2022) doi | Included in the table | Shows bitterness changing with roasting; read in full |
| Physico-Chemical Property, Sensory Profile and Consumer Acceptability of Water Buffalo (Bubalus bubalis L.) Chocolate Milk Using Alkalized and Natural Cocoa Powder (2023) doi | Included in the table | Bitter aftertaste with alkalised powder; read in full |
| Link between Flavor Perception and Volatile Compound Composition of Dark Chocolates Derived from Trinitario Cocoa Beans from Dominican Republic (2023) doi | Included in the table | Spread of bitterness across 54 bars of one recipe; read in full |
| TI・TDS 法によるカカオ豆の異なるビターチョコレートの呈味特性 (2019) doi | Included in the table | Same recipe with only origin varied; read in full |
| カカオ豆産地とチョコレートのおいしさとの関係 (2007) doi | Included in the table | Same recipe with origin varied, correlating bitterness with compounds; read in full |
| The effect of fat content on sensory perception and consumer acceptability of 70% cacao dark chocolate made from reconstituted cocoa liquor (2023) doi | Full text not reachable | Reports lower bitterness with more fat in solid chocolate; full text blocked by a challenge page, abstract only |
| Sensory evaluation of dark origin and non-origin chocolates applying Temporal Dominance of Sensations (TDS) (2018) doi | Full text not reachable | Compared cocoa content with how often bitterness dominated; full text not reached, abstract only |
| Tolerance for High Flavanol Cocoa Powder in Semisweet Chocolate (2013) doi | Read as context (not in the table) | Found where adding high-flavanol powder at fixed cocoa content becomes unacceptable; bitterness not rated |
| カカオ豆のロースト条件とビターチョコレート嗜好の関連性 (2018) doi | Read as context (not in the table) | Same recipe with roasting and origin varied; bitterness values only in figures, cocoa content not varied |
| Microwave Roasting as an Alternative to Convection Roasting: Sensory Analysis and Physical Characterization of Dark Chocolate (2023) doi | Read as context (not in the table) | A comparison of roasting methods; bitterness intensity not scored |
Read in the encyclopedia
- Dark chocolate — the food in this question
- Cocoa powder — the ingredient in the drink comparisons
- Cacao bitterness and astringency — where does it change? — the cacao topic hub
- Is darker-roast coffee more bitter? — a comparison page in the same format
Source ledger
Each study's source can be reached from its section above. All of the lab's sources are listed in the source ledger.
How to cite this page
Aoki, M. (NIGAMI LAB) (2026). Is chocolate with a higher cocoa percentage more bitter?. https://nigamilab.com/en/topics/cacao-percent/
Each claim card has a stable anchor (#clm-…). The dataset is CC BY 4.0; see the data page. Dataset DOI: 10.5281/zenodo.22739101